|
|
|
Sierra Nature Notes, Volume 4, June 2004
When
is the best time to cross a mountain stream?
Understanding
daily variations in streamflow
Jessica
Lundquist, Soon-to-be PhD
Hydroclimatology
Group, Scripps Institution of Oceanography
 |
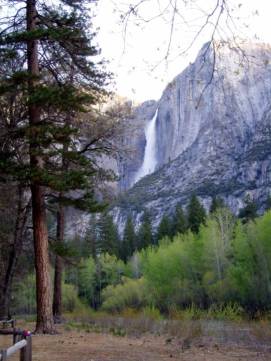 |
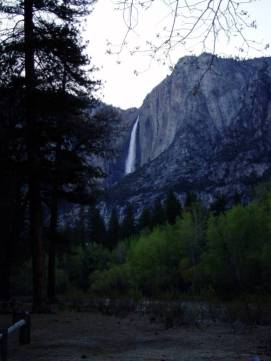
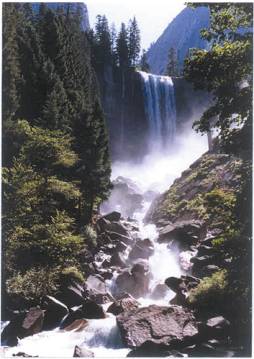
Figure 1: Yosemite Falls, 7:00 pm, 9 May 2003. |
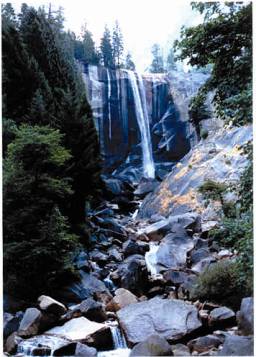
Figure 2: Yosemite Falls, 7:00 am, 10 May 2003. |
“Secrets of Yosemite!” advertised the front of the Special Preview Issue of Backpacker magazine. I spend my summers doing river research in Yosemite National Park, and for once, something had appeared in my mailbox that actually looked useful. I quickly flipped to a page titled “Become a stronger, smarter hiker” and looked at a “Quick Tip” highlighted in a black box. “The best time to cross a stream is in the morning, when the flow is lowest,” the tip read. “During the day, snowmelt can dramatically swell a stream. So if it’s late in the day, consider camping streamside for the night and crossing in the morning.”
Sounds reasonable, but how often is this good advice? I decided to cross Yosemite Creek last May. At 7:00 pm, Yosemite Falls looked rather intimidating (Figure 1), so I decided to wait until morning. However, at 7:00 am (Figure 2), it looked even worse! Was I alone in this observation? In the Gold Seeker (1985, written in 1854), Jean-Nicholas Perlot, a French gold miner, wrote about the difficulties in crossing the Merced River downstream of Yosemite Valley in June: The only way across was cutting a pine and “throwing a bridge over the river.” However, “The next day, on getting up, we were much astonished to see our bridge no longer; the water, during the night, had carried it away… We first observed that it [the river] was three feet higher in the morning than in the evening – that is why our bridge had gone with the current during the night. Should we build another?” The mining was good, and “Each day we threw across the river a bridge which disappeared each night. Soon pines tall enough to serve us as bridges were lacking.” Perlot did not specify how many nights this went on, but he did note that the lowest streamflows were at approximately 5:00 pm!
My friend Boonie Lang laughed particularly hard when she heard about the Backpacker’s advice. “When I was younger, the park service didn’t care so much about how close you camped to the river,” she recalled. “So one trip, hiking down the Tuolumne River, I decided that I could get the most peaceful night’s sleep if I threw my sleeping bag on a little island in the middle of the river. Then I could hear the rushing water all around me all night long.” She started laughing again. “The rushing water woke me up at 3 am! The water rose during the night, and my feet were soaked! No more island-sleeping for me.”
John Muir, with his adept skill at observation, was acutely aware of this phenomenon. In The Yosemite, he wrote, “In the spring, … the Yosemite streams… sing their grandest songs. Countless rills make haste to the rivers, running and singing soon after sunrise, louder and louder with increasing volume until sundown; then they gradually fail through the frosty hours of the night. In this way the volume of the upper branches of the river is nearly doubled during the day, rising and falling as regularly as the tides of the sea. Then the Merced overflows its banks, flooding the meadows, … beginning to rise towards sundown just when the streams on the fountains are beginning to diminish, the difference in time of the daily rise and fall being caused by the distance the upper flood streams have to travel before reaching the Valley.” The French miner came to a similar conclusion, writing, “Now, if the snow melted at seven o’clock in the morning produced its effects for us at five o’clock in the evening, the biggest melting of the day, which took place at one o’clock in the afternoon, must necessarily correspond to the crest which was produced at eleven o’clock. We therefore measured the height of the water at eleven o’clock in the evening, and we observed between this high water mark and that of low water a difference of four and a half feet.”
 |
| Figure 3: Solinst Levlogger measures temperature and water depth every half hour, and stores the data internally for a year. |
The obvious lesson learned is that the best time to cross a mountain stream depends on where you are. Snowmelt takes time to travel down the river, but that’s only part of the story. In Summer 2001, as part of my doctoral research, I worked with scientists from Yosemite National Park, USGS, the California Department of Water Resources, and Scripps Institute of Oceanography placing small sensors in the headwaters of the Merced and Tuolumne Rivers (Figure 3). These sensors measure the weight of the water above them, and from that we know water depth. The sensors record every half-hour for an entire year. We then retrieve them and have 365 days of diurnal fluctuations in water depth. We finally have enough data to make scientific decisions about when to cross a certain stream!
Timing is everything
 |
 |
| Figure 4: Vernal Falls, June 28, 1994, 4.8 m 3/s. | Figure 5: Vernal Falls, August 9, 1994, 0.6 m 3/s. |
First, how large are these fluctuations? From the anecdotal stories, they are large enough to “wash away a pine trunk” or “flood an island or meadow.” Quantitatively, in larger streams, these fluctuations are 10-20% of the total flow (Lundquist and Cayan 2002), and this value can be quite high during peak melt in the stream. Figures 4 and 5 show Vernal Falls just above Happy Isles on two different dates in 1994. In the first picture, 4.8 m 3/s (meters per cubic second) of water is coming down the Merced River, and in the second picture, only 0.6 m 3/s of water are coming downstream, for a difference of 4 m 3/s. From the graph of discharge versus time (Figure 6), we can see that during peak flows in 1994, the variation in a day was about 10 m 3/s, over twice the difference in water pictured here.
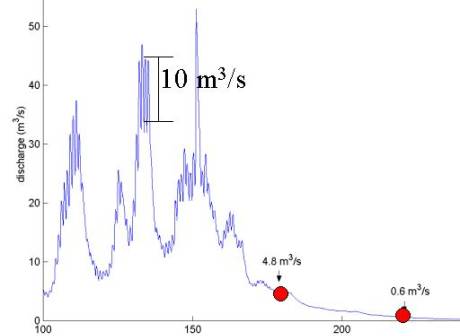 |
| Figure 6: River discharge as a function of day of year for 1994, measured on the Merced River at Happy Isles, just downstream of Vernal Falls. Flows on June 28th and August 9 th are marked with red dots. |
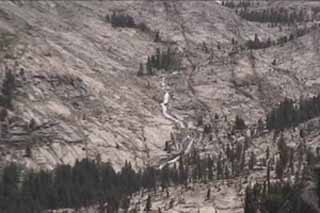 |
| Figure 8: Photo of Marble Fork of Kaweah River in Sequoia National Park. Gage is about half way up the waterfall in the picture. |
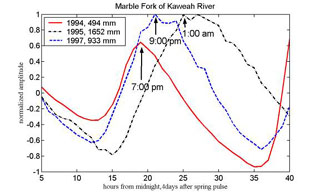 |
| Figure 7: Timing of discharge in the Marble Fork of the Kaweah River near the onset of spring melt for three very different water years. (Larger Graphic) |
Second, how does the timing of these fluctuations vary in the highest, smallest streams? In the high country, where you can see snow on the ground, Backpacker magazine’s advice is good… right? Not necessarily! Timing in the smallest streams actually depends on the depth of the snowpack. The sun melts the most water in the early afternoon, but this liquid melt is at the top of the snowpack and has to percolate through the snowpack before it reaches the stream. Depending on properties of the snowpack, primarily depth and melt rate, this process can take anywhere from 1 to 25 hours! In fact, scientists can use the timing of streamflow in these small basins as an index to estimate the average depth of the snowpack. The time of peak flow at the beginning of the melt season in the Marble Fork of the Kaweah River in Sequoia National Park (Figures 7 and 8) occurred as early as 7:00 pm in 1994 (a dry year with only 494 mm of snow water equivalent in the basin) and as late as 1:00 am in 1995 (a very wet year with 1652 mm of snow water equivalent in the basin). The best time to cross this stream would have been between 11:00 am and 3:00 pm in each of these years (see Figure 7). As the melt season progresses, the snowpack becomes thinner, and meltwater arrives at the stream more quickly. Thus, the time of peak flow shifts to earlier in the day. Rafferty Creek (Figure 9) is typical of most small streams draining into the Merced and Tuolumne Rivers. When melt starts, streamflow peaks between 9 and 10 pm. As the snowpack thins, this time shifts earlier, until peak flows come between 5 and 6 pm during the highest flows of the melt season in early June.
Finally, how does the timing vary downstream, near Yosemite Valley and Hetch Hetchy, where we probably won’t wade the river but might need to know how high to construct a bridge of trees? Surprisingly, the time of peak flow in larger rivers does not depend on the depth of the snowpack (Figure 10). Rather, during the early melt season, the time of peak flow is remarkably consistent between years and occurs near midnight at both the Merced River near Happy Isles and the Tuolumne River near Hetch Hetchy. This timing results from the mixing of streamflows from snowpacks of many different depths, with many different timing delays. Because the timing does not depend on the mean depth of the snowpack, we can forecast the hour of peak flow at these locations years in advance. (Now you can tell your friends with scientific-certainty that it is not a good idea to cross these rivers near midnight in April or May! – just in case they were crazy enough to want to do that in the first place…) The best time to cross is about 4:00 pm in the afternoon because flows start rising at about 5:00 pm, just as Perlot recorded in 1854.
 |
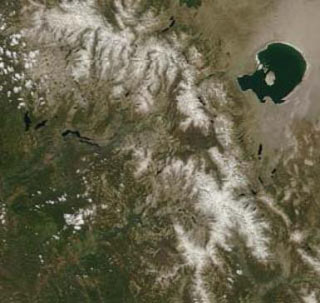 |
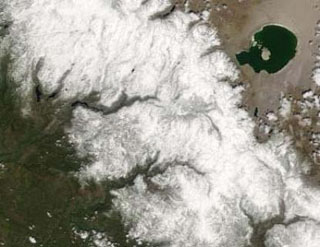
| Figure 11: MODIS image of snowcover from May 10, 2003. Note Mono Lake in the upper right and Hetch Hetchy and Yosemite Valley as the snow-free areas near the center of the picture. | Figure 12: Snowcover image from the MODIS satellite on June 20, 2003 for the same area as in Figure 11. Note Mono Lake in upper right and restriction of snow-cover to the highest peaks. (White marks on the left-hand side of the photo are clouds.) |
What about during the summer, when we’re most likely to be out hiking? By the time most tourists arrive in Yosemite, the snow has retreated to the highest elevations in the park (Figures 11 and 12). At this point, the snow depth is thin in most locations, and flow channels through the snowpack act like freeways and help meltwater to quickly move from the snow to the stream. However, now that the snow is far away, the water is delayed by travel time in the stream channel. This time becomes longer as the snow moves to higher elevations that are further away and longer as water levels drop, resulting in slower in-channel velocities. Larger rivers, like the Merced River in Yosemite Valley and the Tuolumne River at Hetch Hetchy, are further from the snow and have larger delays (Figure 13). By mid-July in most years, peak flows arrive at these locations near 10:00 am the following day!
Jessica’s guidelines for stream crossing times in Yosemite: After showing more science and complexity than you may have wanted, the following are my rules of thumb for the times of peak and minimum daily streamflow, depending on where and when you are in the park (Table 1):
Table 1
Size of Stream |
Early spring melt (April and May) |
Peak melt (early June) |
Late-season melt (mid/late summer) |
Small (like Rafferty or Gaylor Creek) |
Max flow: 9-11 pm Min flow: noon |
Max: 5-6 pm Min: 8-10 am |
Max: 7-9 pm Min: 9-12 am |
Medium (like Lyell Fork of Tuolumne) |
Max flow: 8-10 pm Min flow: 10-12 am |
Max: 8-10 pm Min: near noon |
Max: 10 pm - 3 am Min: noon - 4 pm |
Large (like Merced at Happy Isles or Tuolumne at Hetch Hetchy) |
Max flow: near midnight Min flow: near 4 pm |
Max: still near midnight or slightly later Min: noon-3 pm |
Max: morning, shifting as late as 10 am Min: 3pm-midnight |
In summary,
it’s not always a good idea to set up camp solely for
the purpose of waiting for better stream crossing conditions in the morning.
This generally works near small streams in the summer, but not if you’re
some distance from the snowline. However, setting up camp near a stream for
several days could be a fun experiment. Watch the water rise and fall and
learn what it tells you about the water’s journey from the top of the
snowpack to the spot where you stand.
Reference
and Further Reading
Monitoring snow from
the beach in San Diego:
Automatic snow sensors in the Sierra
by Jessica
Lundquist
Ph.D. Candidate
Hydroclimatology Group
Scripps Institution of Oceanography
University of California, San Diego
Snow
at lower elevations always melts first… or does it?
Synchronous Snowmelt and Streamflow in the Sierra
by Jessica Lundquist Doctoral Candidate
Hydroclimatology Group
Scripps Institution of Oceanography
California
Cooperative Snow Surveys website.
Article about
Frank Gehrke and Dave Hart and snow sensors.
Additional Tables and Figures:
 |
| Figure 7: Timing of discharge in the Marble Fork of the Kaweah River near the onset of spring melt for three very different water years. |
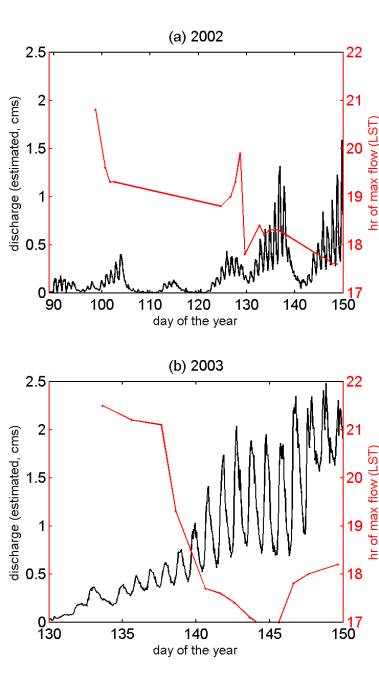 |
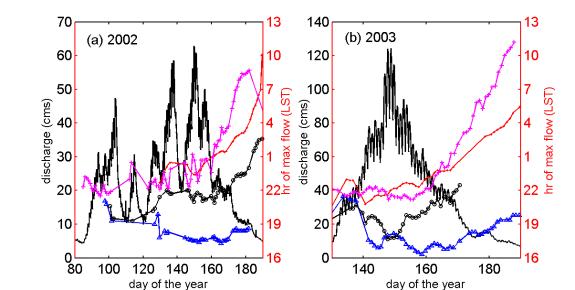
| Figure 9: Dishcarge (black line, left axis) and time of peak streamflow (red-dotted line, right axis) for Rafferty Creek in Tuolumne Meadows, measured at the bridge near the trail juncture to Vogelsang and Lyell Canyon, for a) 2002 and b) 2003. Day 91 = April 1 st, day 121 = May 1 st, and day 152 = June 1 st. Hours are in military notation for local standard time (21 = 9:00 pm, 17 = 5:00 pm). |
 |
| Figure 10: Timing at the Merced River at Happy Isles, 5 days after spring melt began, for years 1992 to 2000. This collection includes very wet years (1995 and 1998) and very dry years (1992 and 1994), and yet the timing is remarkably similar (peaks near midnight, minimums in late afternoon) each year! |
 |
|
Figure 13: Discharge (black line, left axis) and time of peak flow (mulicolored lines with symbols, right axis) at numerous locations along the Tuolumne River as a function of time for a) 2002 and b) 2003. Timing is for the Tuolumne River at Hetch Hetchy (magenta line with +’s), Tuolumne River at Glen Aulin (red line with dots), Lyell Fork of the Tuolumne River near the campground (black line with circles), and Rafferty Creek near the bridge (blue line with triangles). Day 91 = April 1 st, day 121 = May 1 st, day 152 = June 1 st, day 182 = July 1 st. Hours are in military notation for local standard time (22 = 10:00 pm, 19 = 7:00 pm). |
Our Founder Questions? Go to About Our New Site |
Masthead
Photo from: |