|
|
|
Snow
at lower elevations always melts first… or does it?
Hydroclimatology
Group, Scripps Institution of Oceanography
 |
| Author
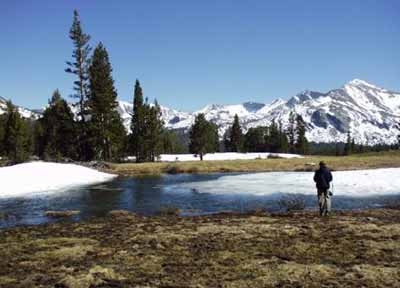
Jessica Lundquist contemplates how snow melts at tarns near Tioga Pass. |
“The
trail up to Gaylor Lakes is still covered in snow,” explained the ranger
in the visitor center, “and the Rafferty Creek trail up to Vogelsang
is closed for the same reason. You’d
better head downstream, toward Glen Aulin and lower elevations.” The meadows, covered with a lake of water,
glistened in the July morning sun, while the surrounding peaks gleamed white
with thick blankets of snow. I shouldered
my pack and headed downstream, to the lower altitudes where the snow melted
first.
After
a summer of hiking the high country and watching the snow gradually disappear
and be replaced by wildflowers, my heart echoed John Muir’s statement
in My First Summer in the Sierra, “For my part, I should like
to stay here all my life or even all eternity.” Six years later, a graduate student in oceanography,
the call to the High Sierra had not diminished. Remembering my hikes and explorations, I proposed
to study snowmelt and streamflow, but as a woman on the plane asked me a
couple months ago, “Why would anyone care about that?” I had more than a few words to say to her!
In
1888, explorer John Wesley Powell reported that the lack of water in Western
North America was a serious obstacle to unbridled settlement. However, in
the century that followed, dams, reservoirs, and aqueducts allowed cities
and agriculture to flourish. In
the West, water is power, and over half of the water supply is derived from
mountain snowmelt where the snow provides a natural reservoir, delaying
runoff and providing water in the spring and summer when it is needed most. However, while the population continues to
grow, an alarming change has been noted in recent decades in the western
U.S. late season runoff. The initiation of spring melt has come progressively
earlier in the season, and runoff from spring and summer snowmelt has declined
markedly (Cayan et al. 2001). In the long run, it is estimated that, in
response to projected global warming of 3 °C, the spring-summer snowmelt will be diminished by about one-third
(Roos 1987). These studies indicate
that winter floods will increase, and less water will be available in the
summer, when demands from both humans and ecosystems are high. Thus, understanding snowmelt processes from
determining the timing, magnitude, and spatial variability of snowmelt runoff,
to better understanding climatic change, has become crucially important.
At
a park research workshop in spring 2001, Yosemite National Park was identified
as having a special role in the earth sciences as a locus for studies of
the responses of natural systems to global and regional climate change,
and scientists from the Park, the California Department of Water Resources
(CDWR), United States Geological Survey (USGS), Desert Research Institute
(DRI), and Scripps Institution of Oceanography (SIO) were quick to collaborate
with each other and rise to the challenge. Fortunately, my thesis topic fell into the
right place at the right time, and I helped design an instrument network
to monitor how snow melts at different locations and then moves through
the river system.
By
August 2001, I was back in Tuolumne Meadows. This time, instead of serving hamburgers to
hungry campers in a sharp-looking red-flannel shirt, I was wearing patched,
frayed shorts and wheeling a metal cart full of cake-pan-shaped concrete
anchors up the trail to Rafferty Creek.
Backpackers, equipped with high-tech, low-weight gear, stared at
the cart with appalled faces. “Are
you sure you have enough stuff?” one man asked, warily.
“Oh yes,” quipped my advisor, Dan Cayan (SIO and USGS climatologist),
who carried a shovel and a coil of metal cable. “We never go out in
the wilderness without all the essentials.”
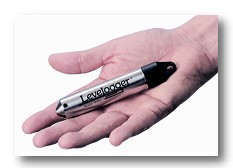 |
| Figure 1 The Levelogger makes hourly measurements of pressure (stream depth) and temperature. |
At
the Rafferty Creek Bridge, we stopped. The creek was completely dry, but we wanted
to measure the return of water when the snowmelt cycle began again next
spring. The research team clamored
under the bridge, and Mike Dettinger (USGS hydrologist) began attaching
cable to a strut under the bridge, while Larry Riddle (SIO meteorologist)
pulled out a Solinst Levelogger (figure 1). The Levelogger, smaller
than the palm of my hand, is placed in the bottom of the stream and measures
temperature and pressure every hour. Most of the pressure comes from the weight
of the overlying water, and the pressure measurement is used to determine
the depth of the stream. Atmospheric
pressure variations are measured with a barometer and subtracted from the
Levelogger measurement. To keep
the lightweight Levelogger from moving in the streambed, we attached it
to a PVC pipe inside a concrete weight, with holes drilled in the top to
allow pressure to equilibrate with the stream (figure 2).
For extra security, Mike clamped a cable from the concrete weight
to the bridge to assure that even if high flows moved the weight, it would
not go far (figure 3).
 |
 |
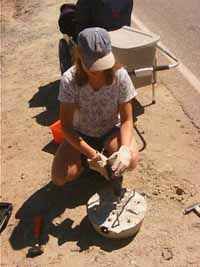
| Figure 2 Jessica Lundquist drills holes through the concrete and pvc pipe that will hold a Levelogger below the Rafferty Creek bridge. In the background, the metal cart full of equipment waits to be wheeled down the trail. | Figure
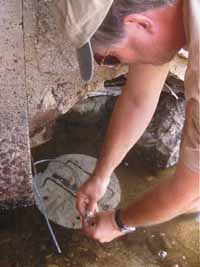
3 Mike Dettinger attaches cable to the concrete weight to make sure
it won't be swept away by high flows. |
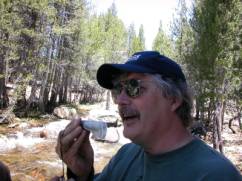 |
| Figure
4 In June 2002, Mike Dettinger is impressed that the Levelogger's
latex freezing-protection shield has survived the winter |
“Looks pretty good,” surmised Dan as Julia Dettinger (Mike’s daughter and an able volunteer) and I moved rocks to conceal the concrete weight and cable, “but there’s no water here now, and this spot could freeze solid before the winter snow comes.” If water around the Levelogger freezes solid, the expanding ice could seriously damage the instrument. “I think this calls for freezing protection,” Larry announced as he began to pour 100-proof alcohol into a latex condom. He inserted the Levelogger into the alcohol-filled condom and sealed the entire contraption (figure 4), carefully placing it into the PVC pipe. Because alcohol freezes at a much lower temperature than water, it should remain liquid and protect the instrument from ice. At the same time, the liquid and latex would be flexible enough to allow the instrument to sense small pressure (stream depth) variations. Still, Larry worried about what the business department at Scripps would say when they saw his receipts and reimbursement request for this important field equipment.
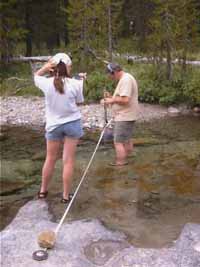 |
| Figure
5 Mike and Julia Dettinger make measurements of water depth and
flow velocity across the Dana Fork of the Tuolumne River. |
With
the instrument secured and protected from freezing water, we had one step
left: to record the actual river flow at the measurement site.
Flow is measured as the volume (cubic feet or cubic meters) of water
moving past the instrument each second.
The water depth, or stream height, measured by our Leveloggers can
be used to infer the flow after measuring both the depth and the flow during
a number of different flow rates and establishing a rating curve (which
relates one measurement to the other).
Today, at Rafferty Creek, the task was easy.
I wrote a big “zero” in my notebook. Yesterday,
Mike and Julia had waded across the Dana Fork of the Tuolumne River with
a tape measure, carefully recording the distance across and the depth at
increments across the river’s width.
At each increment, Mike inserted a flowmeter into the stream (figure
5). As the ring of cups spun with the current, Mike recorded the number
of turns per minute and calculated the water velocity.
Once the cross-sectional area and the velocity are known, the flow
is easily calculated by multiplying the two.
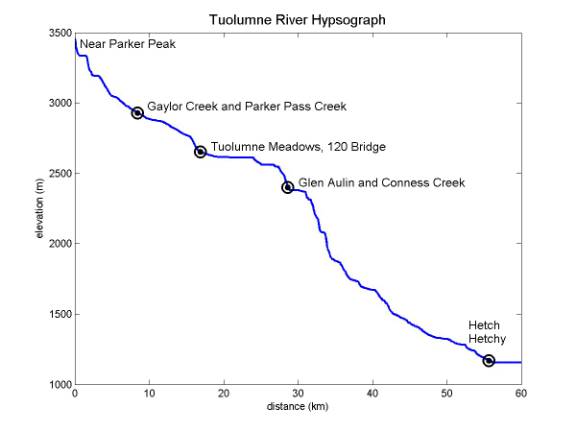 |
| Figure
6 Elevation vs. distance downstream from Parker Peak, showing the
range of elevations monitored by Tuolumne River gages. |
On
average, temperature decreases 6.5C per km elevation gain (3.6F/1,000 ft)
in the troposphere, the lowest layer of the atmosphere. At the surface,
the sun warms the mountaintops, and the average temperature difference is
less, about 4-5C/km (2-3F/1,000 ft) in the Sierra. A dry parcel of rising
air (such as wind forced up and over the Sierra during a winter storm) cools
even more with elevation (9.5C/km or 5.2F/1,000 ft). This occurs because
as the parcel rises, less of the overlying atmosphere weighs down on it,
and it experiences less pressure. Under less pressure, the air expands,
and air molecules come into contact with each other less frequently, resulting
in less rapid motion and cooler temperatures. Cooler air can hold less moisture
than warm air, so this process also increases precipitation with altitude.
This is why, in eneral, higher elevations receive more snow than lower elevations
each winter. These temperature differences also explain why we expected
snow at lower elevations to start melting first. [For more information on
temperature, moisture, and rising and sinking air, see Adiabatic
Processes and Lapse Rates.]
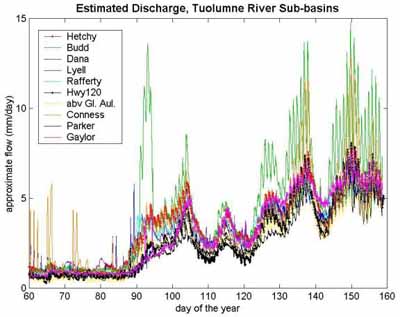 |
| Figure
7 In
2002, every subbasin of the Tuolumne River, regardless of elevation,
started to rise on March 29th, the 88th day of the year.
Flow is normalized by basin area, to show how many mm of snow
water depth would be melting on average everywhere in the basin. |
Fortunately,
the CDWR has been measuring the snowpack for years, and snow pillows
(which weigh the snow on top of them, see
https://sierranaturenotes.yosemite.ca.us/SnowSurvey.htm )
have been reporting the amount of water contained in the snow each day,
at sites ranging between 5,000 and 12,000 feet elevation.
A large number of stations have been operational
for over a decade, and some sites date back to the early 1970s. Armed with data from 44 snow pillows in the
central Sierra from 1992 to 2002, I asked the question, when does the snow
stop accumulating and start melting at each snow pillow? In other words, when does spring begin?
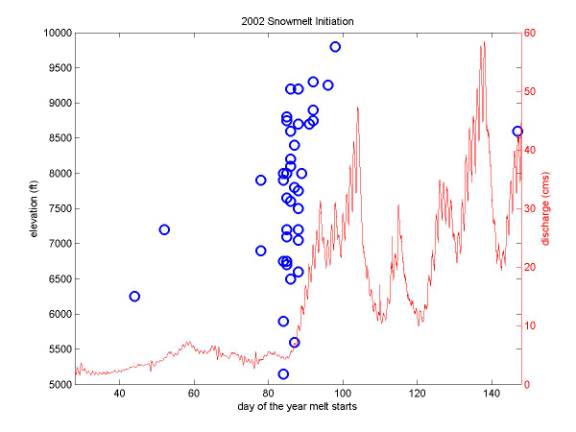 |
| Figure
8 Blue circles
(corresponding to elevation in feet on the left axis) show the day that
spring snowmelt began at each snow pillow.
The red line (corresponding to the right axis) shows streamflow
along the Merced River at Happy Isles (in cubic meters per second) for
the same time period. The Merced
River, like the Tuolumne, rose suddenly on March 29th, when
the snow started melting at all elevations. |
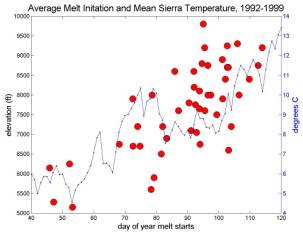 |
| Figure
9 On average,
the lower elevation snowpillows (red dots, elevation in feet on left
axis) start melting earlier in the season, as the temperature (blue
line, right axis) rises. |
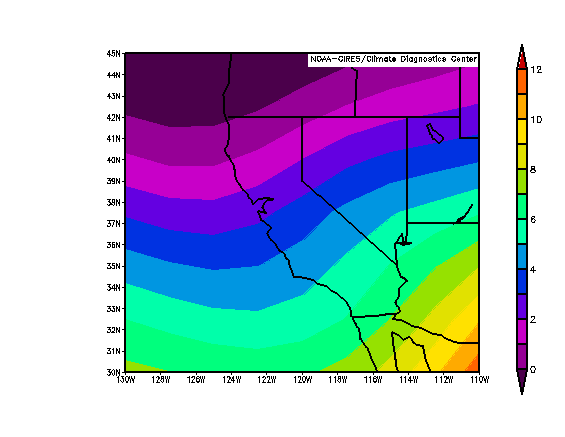 |
| Figure
10 Mean
850 mb (about 1500 m or 5000 ft) temperature for the three weeks prior
to snowmelt initiation for synchronous years. |
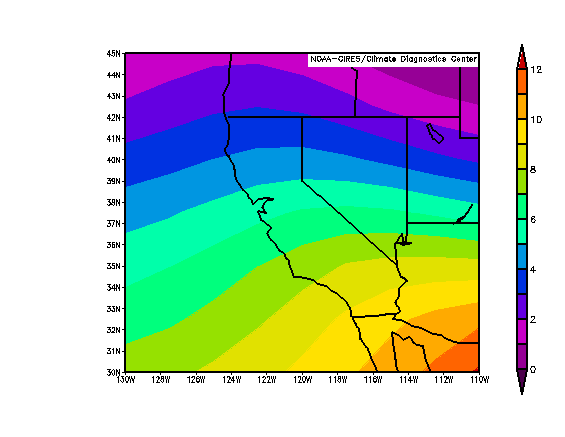 |
| Figure
11 Mean
850 mb (about 1500 m or 5000 ft) temperature for the three weeks prior
to snowmelt initiation for nonsynchronous years. |
 |
|
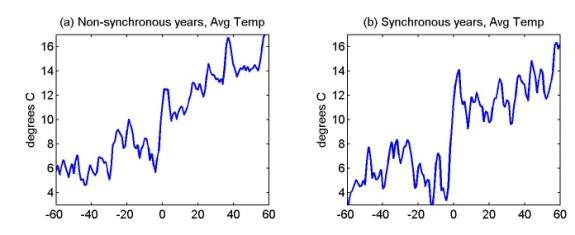
Figure
12
In synchronous years (b), the average
temperature rise on the day of snowmelt initiation (marked by a 0
on the lower axis) is about 10°C (compared to a smaller rise of about 6°C on nonsynchronous years) because late spring storms
keep the temperature depressed until warm, dry air moves into California
and forces snow to start melting everywhere at once. |
Acknowledgements:
This
research is funded by a Canon National Parks Scholarship, and by the California
Institute for Telecommunications and Information Technology (Cal-(IT)2),
NOAA, NSF ROADNet, and the California Energy Commission. Special thanks to Patricia Lundquist and Michael
Dettinger for edits and comments.
References:
Cayan,
D. R., S. A. Kammerdiener, M. D. Dettinger, J. M. Caprio, and D. H. Peterson,
2001. Changes in the onset of spring in the Western United States. Bull.
Am. Met. Soc., 82, 399-415.
Peterson,
D. H., R. E. Smith, M. D. Dettinger, D. R. Cayan, and L. Riddle, 2000: An
organized signal in snowmelt runoff in the western United States.
J. Am. Water Resour. Ass., 36,
421-432.
Roos,
M., 1987. Possible changes in California snowmelt runoff patterns. Proceedings
of the 4th Annual PACLIM
Workshop, Pacific G
Our Founder Questions? Go to About Our New Site |
Masthead
Photo from: |