|
|
|
A vegetation
transect along the Sierran Pacific Crest Trail
Rob York1,
Jennifer McElhaney2, John Battles2
1Center for Forestry, University of California- Berkeley.
4501 Blodgett Forest Road - Georgetown, CA 95634. e-mail: ryork@nature.berkeley.edu
2Dept. of Environmental Science, Policy, and Mangement,
University of California- Berkeley. 151 Hilgard Hall, Berkeley, CA
94720
 |
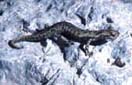
An
early phase vegetation type along the Pacific Crest Trail, Sierra Nevada.
(click to enlarge) |
Every spring, hundreds of backpackers from around the globe gather in the small town of Campo, CA near the Mexican border. Their goal is to "thru-hike" the entire 4265 kilometer (2650 miles) length of the Pacific Crest Trail (PCT), ending in Manning Park, British Columbia. Motives vary from adventure to escapism; ages vary from teenagers to retirees. There are vastly different hiking strategies, equipment, and personalities. No matter the background, in one summer each hiker develops a common expertise sought after for years by many students in universities: They become ecologists. The thru-hiker variety of ecologist develops a unique understanding about the relationship between natural influences of climate, geology, topography, and disturbances on patterns of flora and fauna. They develop this expertise as a necessity for making their way on foot across five mountain ranges from Mexico to Canada. After hiking through the desert for two weeks, a thru-hiker can anticipate where to find water based on the topography and vegetation. After even longer hiking through the desert, some insist they can smell water within a half-mile. Likewise, a thru-hiker's selected campsite is always an ecologically informed decision based on potential biotic and abiotic factors that may influence a restful night's sleep. Whether subconscious or deliberate, a thru-hiker's ecological insight is developed only after the patterns of nature have been seen day after day.
The daily repetition of hiking on the PCT is the key to a thru-hiker's eventual comprehension of the amazing variability of nature that occurs across the 24 to 40 kilometers (15 to 25 miles) typically traveled in one day. At small scales, plant physiologists capture the variability of a single tree, as it transforms a single trunk into an uncountable number of branches and leaves. A community ecologist or forester might size up a stand of trees, filled with variety at multiple levels from the composition of herbs on the forest floor to insects in the upper reaches of the canopy. At even larger scales of landscapes and regions, the diversity is unfathomable without the aid of remote sensing technology. Between the scale of ecological communities and landscapes lies the scale that thru-hikers grasp the variability of nature. This variability is captured and processed by the eye and mind of a thru-hiker ecologist much like data is collected and analyzed by a scientific ecologist. Yet the difference between a thru-hiker's results and a scientist's results is inherently vast. The thru-hiker processes images and experiences along the trail as a matter of interest and for practical use in hiking. The scientist records data methodically as a matter of consistency and accuracy for use in making statistical inferences. The thru-hiker's method of understanding nature lacks objectivity and duration (human memory is selective and fleeting), while the ecologist's method lacks a visual and conceptual association between nature (reality) and the data that describe it. When this philosophical divide between the naturalist-style of ecology and the scientific-style of ecology is bridged, results have potential to reflect a broad understanding of nature.
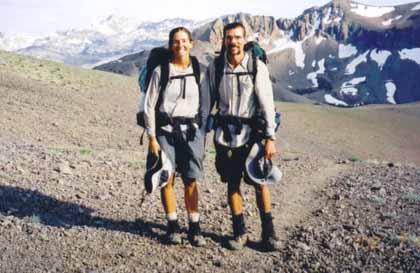 |
| The first and second authors in an alpine habitat vegetation type (Sonora Pass). |
In an attempt to bridge scientific ecology and thru-hiker ecology, we thru-hiked the California section of the PCT, using it as a platform for a latitudinal transect of vegetation types. Below, we report results from the 1160 kilometer long (721 miles) section that spans the Sierra Nevada range. We first describe the methods and results as objective ecologists, then supplement the results with insights from our on-the-trail education in thru-hiker ecology.
Research
design and methods
We tracked
the changes that occur in vegetation type and successional phase as it
varied by elevation, latitude, and property type. The practical application
of the results will serve as a geographical reference and help guide
a future study aiming to predict structural and compositional changes
of forests given the current disturbance regime, which has placed forests
in a novel setting through fire suppression activities.
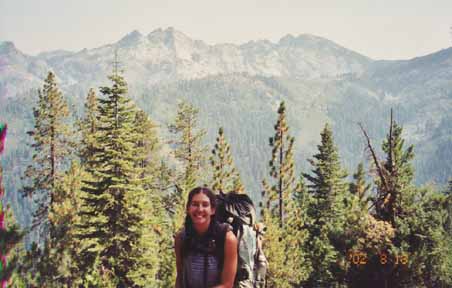 |
| The second author in front of a middle phase, mixed conifer series vegetation type |
Most geographers delineate the southern boundary of the Sierra Nevada at Tehachapi Pass on Highway 58 (Hickman 1993; Sawyer and Keeler-Wolf 1995). The north fork of the Feather River juxtaposed to Highway 70 usually marks the northern end, where the Sierra gradually give way to the southern Cascades. We used these boundaries as our transect beginning and ending points. Along the transect, we delineated vegetation types, as defined by the California Manual of Vegetation (Sawyer and Keeler-Wolf 1995). The minimum mapping unit for delineating a vegetation type was 1.4 kilometers (.87 mi). Transect distance was measured by recording the time spent passing through a type and an estimate of walking speed. Measurements were double-checked with distances between landmarks that were measured previously (Schaffer et al. 2000). Our estimate of total trail distance (net error) was within 2% of the actual distance. We typically measured 24 to 32 kilometers (15 to 20 miles) of transect length per day.
|
Phase |
N |
Trail distance (km) |
% of trail |
Description of phases |
|
Unassigned |
21 |
68.4 |
6 |
-- |
|
Early |
50 |
133.6 |
12 |
Evidence of recent disturbance, brush or pioneer species dominant |
|
Early mid |
35 |
69.4 |
6 |
Small trees are overtopping brush |
|
Mid |
104 |
245.0 |
27 |
Trees form continuous canopy, inter-tree competition is heavy |
|
Mid late |
105 |
289.7 |
26 |
Some individual tree mortality and stand reinitiation in canopy gaps |
|
Late |
95 |
276.8 |
23 |
Old-growth features- mixed structure, large trees |
Table 1. Frequency and coverage of phase types along the Sierra Nevada section of the Pacific Crest Trail. N is the number of times the phase was measured. Unassigned types were either unintentionally missed or inconclusive.
Our measurements were limited by the necessity for lightweight travel, often consisting of > 7 days between resupply points (nearby towns). A compact GPS receiver, altimeter, palm-top computer, solar battery charger, and a prism wedge for measuring basal area made up the suite of measuring equipment. Three metrics for each vegetation type were measured: elevation, global position (UTM projection), and transect length. Categorical variables recorded included vegetation type, % cover (estimated), property type, disturbance evidence, and successional phase. Successional phase was classified into early, early-middle, middle, middle-late, and late categories (Table 1). Phase definitions were generally guided by the model of forest dynamics developed by Oliver and Larson (1996).
The PCT as
a transect
A
thru-hiker's
ecological study is not without bias. Objective ecology is the study
of organisms and their environment without being subject to opinion on
the beauty or human-placed value of the environment. Conversely, most
thru-hikers prefer when their "outdoor laboratory" passes under the comfortable
shade of a forest rather than under the blistering desert sun. They hike
wherever the trail takes them, the path of least resistance often guiding
the original trail construction. To assess this transect bias in terms
of trail deviance from a due south-to-north direction, we plotted distance
advanced to the north against actual trail distance (Fig. 1). A slope
of one would indicate a direct course north. For every kilometer advanced,
the transect advanced about one half kilometer (slope = 0.5). However,
the slope remained fairly constant throughout the transect. In other
words, the trail did not always head directly north, but its "northness
tendency" remained constant throughout. We interpret this to mean that,
while the trail is not a true straight latitudinal transect, its inherent
bias is lessened by the constant northern progress that it makes.
 |
| Figure
1. South to north elevation profile (black line) of the Sierra
Nevada section of the Pacific Crest Trail. The dashed line tracks
a due north course ("beeline"), while the solid blue line tracks
the trail's actual northern progress. Elevation is given in meters;
trail distance is given in kilometers. (click to enlarge) |
Results and
discussion
The Pacific
Crest Trail provides an integrative, ground-based sampling location that
facilitates the observation of vegetational patterns through the upper
montane regions of the entire Sierra Nevada range. These results provide
information about the distribution of vegetation and successional phase
types as they change with elevation, latitude, and landowner. Future
investigations will depend on these results to focus sampling efforts.
The average trail elevation was 2544 meters (8,348 feet), ranging from 701 to 4017 meters (2,300 to 13,180 feet) (Fig. 1). The vegetation type changed along the transect 410 times (every 2.4 kilometers). Eleven vegetation types were identified to the series level (analogous to species in Linnaean taxonomic classification), and 10 were identified to a hierarchical level above series (Table 2). The lodgepole pine series was the most frequent and covered the most distance.
|
California Vegetation type 1 |
N |
Kilometers |
% of trail |
|
Lodgepole pine series |
149 |
375.6 |
34.7 |
|
Singleleaf pinyon pine series |
26 |
123.1 |
11.4 |
|
Red fir series |
52 |
108.8 |
10.1 |
|
Montain meadow |
34 |
75.0 |
6.9 |
|
Alpine habitat |
23 |
64.6 |
6.0 |
|
Five-leaved pine forest |
24 |
63.6 |
5.9 |
|
Mixed conifer series |
16 |
53.5 |
4.9 |
|
Jeffrey pine series |
17 |
41.8 |
3.9 |
|
Desert scrubs |
7 |
39.4 |
3.6 |
|
Mountain hemlock series |
20 |
38.4 |
3.5 |
|
White fir series |
13 |
29.4 |
2.7 |
|
Manzanita chaparrals |
9 |
21.3 |
2.0 |
|
Chaparrals |
3 |
9.7 |
0.9 |
|
Western juniper series |
3 |
7.4 |
0.7 |
|
Interior live oak series |
2 |
6.0 |
0.6 |
|
Oak chaparrals |
2 |
5.6 |
0.5 |
|
Mixed live oak forests |
2 |
4.8 |
0.4 |
|
Live oak chaparral |
3 |
4.6 |
0.4 |
|
Herbaceous plants |
1 |
4.0 |
0.4 |
|
Aspen series |
2 |
2.8 |
0.3 |
|
Douglas-fir series |
1 |
1.6 |
0.1 |
|
Willow thickets |
1 |
1.6 |
0.1 |
| 1Vegetation types described in Sawyer and Keeler-Wolf (1995). |
Table
2. Sierra Nevada Pacific Crest Trail vegetation types. N = the number
of times the vegetation type was recorded. The kilometers column
is the total trail distance covered by that type. % of trail is the
percent of the trail covered by the type.
Most of the
trail was in federally owned wilderness (WILD) areas, followed by lesser
amounts of land under National Forest Service (NFS) and National Park
Service (NPS) ownership (Fig. 2). The late phase was the most common
successional category in WILD and NPS lands, and the middle phase was
most common in NFS lands. For the three most common property types, the
early and middle-early phases were the least common. If our transect
was not representative of the actual vegetation and there was actually
equal portions of the five phase types within each of the property types,
the expected frequency of each type would be about 20%. A simple statistical
test (Chi-squared Likelihood Ratio) that compares the actual portions
of phase types that we found against a hypothetical result of equal portions
among the phases (20% chance of getting each phase) shows that given
our data, there is a less than 1% chance that the distributions are equally
distributed among the phases for each property type. In other words,
it is very likely that some phase types were more common than others.
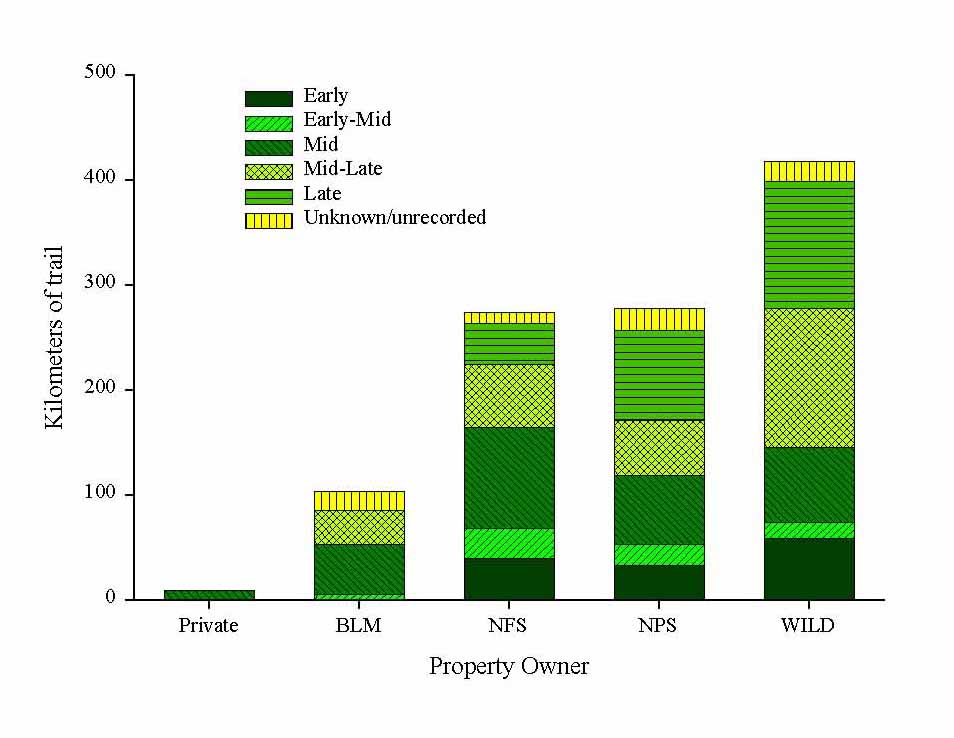 |
| Figure
2. Distributions of property types and successional phases
along the Sierra Nevada section of the Pacific Crest Trail. The
Y-axis is trail distance (kilometers). BLM = Bureau of Land Management;
NFS = National Forest Service; NPS = National Park Service; WILD
= federal wilderness areas. (click to enlarge) |
Because both elevation and latitude can influence the disturbance regime, they are potentially contributing factors when accounting for the spatial distribution of successional phases. For example, the average elevation of the PCT on NPS land was 2935 meters (9,629 feet), compared to 2359 meters (7,739 feet) on NFS land. Despite these differences, neither elevation nor latitude had a significant effect when coupled with property type as explanatory variables of phase type. Vegetation along the PCT in the northern Sierra Nevada is as likely to be in late or early phases as is vegetation in the southern Sierra Nevada. Similarly, as one climbs in elevation along the PCT no consistent stratification of phase type occurs.
Thru-hiker
ecological insights
As
with many students and professionals working in natural resources, the
authors
of this article spend most of their time either reading about studies
of nature or analyzing data to quantify nature. We never could have learned
the "thru-hiker" field of ecology by reading journals or analyzing data
in the lab. Only by spending four months on the trail did we begin to
comprehend the variability of nature as it changed mile after mile. We
learned that occasionally we could confidently guess why a forest looked
like it did based on obvious evidence. But for the most part, we needed
measurement instruments more unbiased and precise than our own senses.
However, the weight and time spent operating such instruments would have
precluded the long distances that we covered from day to day. It is the
long distance and continuity of the PCT that make it unique as a sampling
platform. The tradeoff between gathering intensive and extensive data
that is common in natural resource sampling was especially clear during
this study. Our effort for data collection was obviously more extensive
than intensive.
Using categorical variables in research always carries the risk of researcher bias. We have to subjectively define the categories and then decide how to assign them. On the trail, we eventually became comfortable with our consistency in assigning vegetation and phase types, but this happened only after at least two weeks of day-to-day hiking. Further, our judgment of consistency is subjective. While we could have re-measured a sample of the transect to assess precision, accuracy and bias would remain unknown. Our thru-hiker insight is that the use of continuous variables (such as those presented in Figure 1) is preferred, even when the repetition of thru-hiking is employed.
The insight we gained from living on the PCT for four months was invaluable for our personal development as research ecologists. To actually understand the reality of what data represent is too often lost on the investigators who collect and analyze it. Thus, we need both the trained senses of naturalists and the scientific methods of ecologists to begin figuring out why nature is what it is.
Acknowledgements
We thank the
many friends and family who provided logistical support, especially Barbara
Pauly. The California Agricultural Experiment Station provided funding.
Links
The Pacific
Crest Trail Association: http://www.pcta.org/
Battles Forest
Community Ecology Lab: http://ecology.cnr.berkeley.edu/battles/index.html
Literature
cited
Hickman,
J. C. 1993, The Jepson manual: higher plants of California. Berkeley,
CA, University of California Press.
Oliver, C. D., and B. C. Larson. 1996, Forest Stand Dynamics. New York, John Wiley and Sons.
Sawyer, J. O., and T. Keeler-Wolf. 1995, A Manual of California Vegetation. Sacramento, CA, California Native Plant Society.
Schaffer, J. P., B. Schifrin, T. Winnett, and R. J. Jenkins. 2000, The Pacific Crest Trail Volume 1: California. Berkeley, CA, Wilderness Press.
Our Founder Questions? Go to About Our New Site |
Masthead
Photo from: |